


TV sets dominate in-home viewing as OzTAM adds device-level reporting to Q4 Streamscape report – OzTAM has released the Q4 2025 edition of Streamscape, expanding the report to include device-level in home viewing for the first time and confirming that the television screen remains the centre of video consumption in Australian homes.
The release covers October to December 2025 and includes a full-year 2025 overview of viewing to TV sets.
Device-level reporting: new in Q4 2025
For the first time, Streamscape reports viewing across in-home connected devices, including smartphones, computers and tablets, expanding the scope of video viewing measured within the home. Developed in collaboration with Nielsen and drawing on its global measurement expertise, this enhancement further strengthens and evolves Streamscape reporting.
As a result, the Q4 report captures 17% more in-home viewing minutes than previous Streamscape releases.
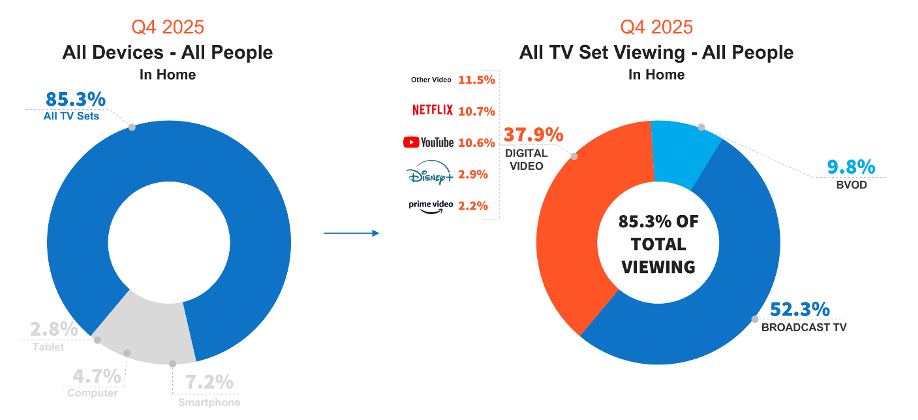
In Q4 2025, the majority of Total People in-home video viewing occurred on TV sets (85.3% of total minutes), followed by smartphones (7.2%), computers (4.7%) and tablets (2.8%).
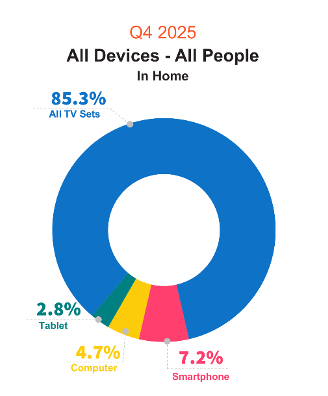
Source: OzTAM Panel Data & VOZ 2025 – Total Minutes Viewed (Extracted from All TV Sets in Home and Tablet, Computer & Smartphone devices In Home via Home Internet) | Markets: National | Date Parameters: October – December 2025 (Calendar months)
The share of in-home viewing occurring on TV sets is consistent with established international benchmarks. In the UK, around 84% of in-home video viewing occurs on TV sets, while in the United States the comparable figure is typically close to 80%.
Viewing trends on TV sets
Q4 2025
Free-to-air Total TV, across both broadcast TV and BVOD, accounted for 62.1% of viewing to TV sets, with broadcast TV alone accounting for 52.3%.
Streaming activity across both BVOD and SVOD services increased during the quarter, aligning with the northern hemisphere winter release cycle for global content and broader local seasonal shifts in viewing behaviour.
Source: OzTAM Panel Data & VOZ 2025 – Total Minutes Viewed (Extracted from All TV Sets In Home only) | Markets: National | Broadcast TV: ABC, Seven, Nine, Ten, SBS | BVOD: ABC iView, 7plus, 9Now, 10, SBS ON Demand | Digital Video: Netflix, Kayo, Foxtel, Disney+, Amazon Prime Video, Stan, Paramount+, Binge, Apple+, Britbox, Hayu, AcornTV, YouTube, HBO Max | Other: Fetch TV, LG TV, Samsung TV, Roku, Tubi and Other Streaming | Amazon Provision: Amazon Prime Video share includes Amazon distributed channels such as Hayu, Britbox etc. From Q2 2025 Paramount+ viewing via the Amazon platform is being attributed to Paramount+| Date Parameters: October – December 2025 (Calendar months)
Full year 2025*
Across the full year 2025, free-to-air Total TV (broadcast TV and BVOD) dominated TV set viewing, accounting for 67.7% of Total People minutes. Broadcast TV contributed 58.5% while Total BVOD represented 8.9%, and Digital Video (SVOD / AVOD) 32.6%.
“The addition of device-level viewing to Streamscape is a meaningful step forward for the industry, capturing 17% more in-home viewing minutes and providing a clearer view of how Australians are consuming video across screens in their homes,” said Karen Halligan, Chief Executive Officer at OzTAM. “The Q4 All Device results confirm that the TV screen remains the most powerful medium for in-home viewing in Australia, accounting for 85.3% of total minutes, and which is closely aligned with global markets.”
The Streamscape report is expected to transition to a digital, interactive dashboard in early 2026, enabling deeper analysis, improved cross-referencing and more efficient extraction of data for industry planning and trading tools.
Notes and Definitions:
– Broadcast TV: ABC, Seven, Nine, Ten, SBS
– BVOD: ABC iview, 7plus, 9Now, 10 and SBS On Demand
– SVOD / AVOD / Digital video: Netflix, Disney+, Amazon Prime Video, YouTube, other online video
* Full-year figures relate to viewing on TV sets only.
Device-level reporting applies to Q4 2025 only.
TV-set viewing refers to all television screens in the home, whether connected to the internet or not.
RelatedPosts


Streaming services logos and brand names (including but not limited to Netflix, Disney+, Prime Video, YouTube and Amazon) used within, or in relation to, the OzTAM Streamscape report are the property of their respective owners and are used in the Report for identification and reporting purposes only. OzTAM makes no claim of endorsement from or affiliation with these services, and their inclusion does not imply any commercial relationship.
About OzTAM
OzTAM is Australia’s official source of television audience measurement and the supplier of VOZ, the industry’s Total TV currency data.
VOZ brings together broadcast viewing on TV sets and granular BVOD viewing on connected devices to provide truly national, de-duplicated, all-screen, cross-platform planning, trading and reporting for Australia’s media industry.
OzTAM also supports data solutions like VOZ Streaming for programmatic BVOD trading and Streamscape, a quarterly report offering a unified view of Total Video consumption across broadcast, BVOD, and streaming platforms.
Media Release – Third Avenue
Link to OzTam HERE
TV Central Ratings content HERE
TV sets dominate in-home viewing as OzTAM adds device-level reporting to Q4 Streamscape report
